Monday 3 August 2020

Benefits of GIS in Urban Planning

Benefits of GIS in Urban Planning 

Investigating the Squatter Settlements in Eskisehir, Turkey


Traditional methods of information management are hard to use in the planning process of problematic urban areas such as squatter settlements. GIS provides the capability for dynamic query and analysis, display of information and a more understandable representation. By introducing GIS, the authors analyse the social and infrastructure possibilities of the squatter settlements in Eskisehir Municipality. They determine areas with inadequate public services and infrastructure, and provide basic solutions.

The problems of large metropolitan cities have been comprehensively studied by many researchers. Nevertheless, a country that just consists of a few very large urbanised areas arbitrarily embedded in a rural context is not viable and not optimally sustainable. A network of medium-sized cities that are evenly distributed over the territory is more feasible. Therefore it is important to also investigate the problems of these smaller cities. The city of Eskisehir, Turkey, has been chosen as a case study. This city is located in the northwest of Anatolia at an equal distance from the primary metropolis Istanbul and the capital Ankara.
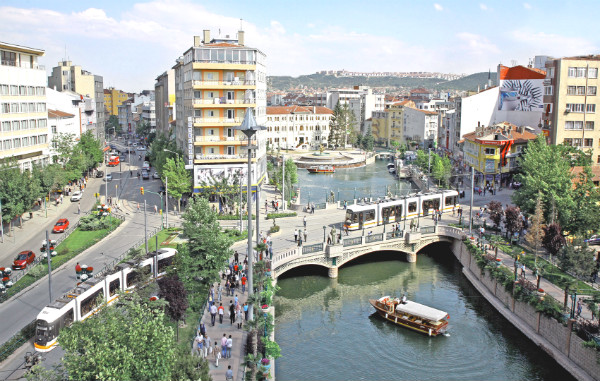
center of Eskisehir, Turkey

The city Eskisehir in Turkey

Demography: increase people living in urban areas

Turkey’s urban population has grown from 23.6 million in 1985 to 44.1 million in 2000. During this 15-year period, the proportion of people living in urban areas has increased from 45.2% to 65.1%. These figures show that although Turkey’s level of urbanisation is lower than in western countries the rate of growth is very high. One of the worrying results is the uncontrolled settlement of low-income families in squatter areas. Housing is a basic human right, but without effective control it may harm the ecological balance. The construction of informal houses was not common in Eskisehir until the 1970s. As a result of rapid industrialisation, housing stock became insufficient after the 1970s and squatter settlements started to concentrate around industrial sites and along the main roads. Today, about 30% of the population lives in squatter areas. In 1997, over 154,000 people lived in the 16 squatter areas, whilst in 2000 the number had risen to nearly 169,000. Settlement is made easy by property developers who divide the land into parcels, often illegally. The developers do not put much effort into constructing basic services because their main interest is profit; they are not concerned with living standards or environmental balance.

Planning and GIS

Planning involves determining appropriate future decisions and actions through a series of choices. Making choices requires, in addition to thorough planning knowledge, comprehensive (geo-)data about the past, present and future. The information may be descriptive, predictive or prescriptive in nature. Appropriate and efficient management of information greatly improves the quality of planning. Generation of the proper type of information is very difficult with manual methods. GIS provides many basic functions for appropriate and efficient management of geo-information. Essentially, GIS supports the collection, maintenance, analysis and display of spatially related information. GIS data enable multiple viewpoints to be considered and provide the capability for dynamic query and display of information, and a more understandable representation. On the other hand, the accessibility of digital data may cause abuse and misuse, raising fundamental issues of data security, responsibility and reliability.

Understanding the planning area

Statistics, reports, articles, aerial and close-range photos, satellite images, maps and drawings all aid in understanding the planning area and its problems. Alternative solutions may be developed by importing this data into computer models. These models may predict, for example, demographic changes and land use modifications or simulate traffic flow. Often these computer models are implemented as stand-alone software. GIS facilitates by providing digital geo-data and display of intermediate and final results. Arriving at the most appropriate solution requires communication and collaboration among many stakeholders. Communication is best done through visualisations such as images and maps rather than through bare text. GIS is a perfect visualisation aid. So, GIS makes model creation and interpretation easier and provides understanding that may otherwise not be achieved.

Database

A database was created by an extensive survey of land use and population statistics of Eskisehir. All analogue maps and plans were scanned, and blocks and buildings digitised. Numerical data were converted into tables, graphs and maps. A basic image and GIS layers were created as thematic maps in a topological data structure. Topologically coded geo-data enables spatial query and analysis whilst large and complex sets of diverse data types can be efficiently managed. Issues such as insufficiency of public services and infrastructure and accessibility of public services can in this way be addressed more easily than by traditional methods. All the themes such as districts, public facilities, blocks and houses were stored as separate layers, which can be easily represented graphically. Many layers were created using the basic image as source. Data created with the Turkish GIS software package NetCAD were converted to data compatible with ArcGIS 8.3.

Analysis

The analysis and overview are based on relevant literature, amnesty laws, statistics from the State Statistics Institute created in 2000, maps, master plans and reconstruction improvement plans (upgrading), field surveys, data from concerned authorities and from the reports written by these authorities and organisations. The parameters used during analysis included:

  • population
  • number of storeys
  • sufficiency of public services according to the planning standards
  • walking distances to public services
  • area of public services.


From the descriptive information such as infrastructure, population data and area of the districts, the following parameters were derived:

  • floor area coefficient of the houses
  • presence of basic services and infrastructure in uncontrolled settlements.


Results

As a result of legislation of squatters by amnesty laws and weakened fear of demolition of houses, the number of the squatters has increased year after year. After the last amnesty laws, municipalities were allowed to upgrade district plans and increase the number of storeys to four. Compared to standards and law, public services are inadequate; the ratio of services to the number of people is low and walking distances are too high. Even the ratio of proposed public services to the existing population is too low according to the standards defined in developmental regulations. While 98% of the houses in 1989 had a septic tank, in 2002 60% of the houses were connected to the sewer system, 39% had a septic tank and 1% did not have any disposal system. Nearly all buildings have electricity and indoor running water (99.2% and 91.5%, respectively). These proportions are larger than Turkey’s average. None of the districts are connected to a source of natural gas. Suitability factors, factor scores, factor weights and permitted land use conversions can be specified for all land use by using GIS. Automated mapping allows the efficient handling and dissemination of thematic information enabling quick map making for planning and decision making.

Conclusions

Housing demands in Eskisehir will increase in the foreseeable future. To prevent future settlement of squatters, the following has to be done:

  • Eskiºehir Municipality should take preventive measures by identifying possible development areas for settlement in agreement with development of industrial sites, housing areas proposed in the master plan, municipal services, public land and the transportation network
  • after identification of settlement areas, site and service specifications should be ensured by constructing roads, water and electricity supply, drains and sewerage, layout of plots and service areas
  • the use of GIS techniques should be stimulated to support settlement development by using planning models and scenarios and proper data in digital format.


Google Maps: Eskisehir


Read more about GIS
Read more about Urban Planning

Thursday 22 August 2019

The history of ArcGIS

The history of ArcGIS

EsriEnvironmental Systems Research Institute, knew there was a starving market for location-based systems also known geographic information systems (GIS). In 1990s, Esri started working on a product that later became one of the best enterprise solutions for GIS implementations on Windows systems. In 1999, ArcGIS was released. Since then, ArcGIS hasbecome the most used commercial GIS solution. ArcGIS was then renamed ArcGIS for Desktop, and the ArcGIS name was used as a product line instead to carry lots of products under it.
Buy Surveyors Ebooks  herehttps://payhip.com/HeroizuTechng

When the Web started to become ubiquitous in early 2000s, Esri adopted the Web by rolling in ArcGIS for Server and gradually ArcGIS functionalities as web services so that it could be supported on multiple platforms including mobile phones.

A decade later when the cloud solutions began to surface, Esri released its Software as a Service (SaaS) solution ArcGIS Online. Designed to simplify the user experience, ArcGIS Online hides all the ArcGIS "contraptions" and technologies to relieve the user from maintaining the hardware and software, leaving the user to do what they do best, mapping. Having everything in the cloud allows users to focus on their work instead of worrying about configurations, spinning up servers and databases, and running optimization checks.

Note

SaaS, a cloud-based software distribution model where all infrastructure, hardware, management software, and applications are hosted in the cloud. Users consume the applications as services without the need to have high-end terminal machines.

Today, Esri is pushing to enhance and enrich the user experience and support multiple platforms by using the ArcGIS Online technology.

In this book, we target one of the core products of the ArcGIS family—ArcGIS for Desktop. By using real-life examples, we will demonstrate the power and flexibility of this 16+ year-old product ArcGIS for Desktop. We are going to use the various tools at our disposable to show how we can extend the functionality of ArcGIS for Desktop.


You are currently viewing a FREE SECTION

Get access to all of Packt's 7,000+ eBooks & Videos
Over 100 new eBooks and Videos added each month
10-day FREE trial. Renews at $9.99 per month


Skill Up with Packt

Wednesday 21 August 2019

*Step-by-step work through on earth volume computation using sufer*

*Step-by-step work through on earth volume computation using sufer*
The procedure assumes you already have sufer installed on your PC
👉Launch the sufer application by double clicking its icon on your desktop
👉On the program main menu, click Grid
👉Click data... in the drop down sub-menu
👉Navigate and locate the raw file containing your x,y,z data defining the surface in question
👉Click Open
An interface showing some sample of your data is displayed on the screen
👉Ensure that the appropriate field delimeter is selected and click OK
👉On the Grid Data interface that comes up next, select the appropriate field (i.e column) for each of your x, y, z data as contained in the previous interface
👉Select any desired griding method on the space provided for such on the Grid Data interface. The common and default method is kriging
*Note* : the result you obtain depends pretty much on the grid method you select as each of the methods uses different models in predicting the Grid elevation of the unobserved points
👉Click OK
The griding is then carried out by the application and the report displayed on the screen that can be saved to a file
*Note:* These procedures applies for each of the surfaces in the case of two surfaces volume computation. For a single surface, you just do that once for the available surface file

Next is to compute volume using the grid file created
👉On the program main Menu, click Grid
👉Click Volume in the drop down menu
👉Browse and locate the grid file created
👉Click to open the file
👉The Grid Volume interface pops up where you are expected to define your surfaces
👉The upper surface is natural ground surface (Topo-surface) for which a grid file has been created
👉The Lower surface is the grade or design surface
👉 For each of the surfaces, you can either chose to load a grid file or use a constant value
👉For a single surface volume with only the natural ground grid surface elevations, click and upload the grid file for the upper surface and define a constant, z value for the lower surface   (graded surface)
👉 Leave the Z- factor as 1
👉Click OK
The cut and fill volumes are displayed with the associated areas obtained

*Note*: the results earth volumes may vary from one application to another even with the same data depending on the method for computing areas and of course the griding method

FUSING IN CAD CAPABILITIES INTO GIS. BY HONEST S. O. U.

FUSING IN CAD CAPABILITIES INTO GIS.       BY HONEST S. O. U.              

ArcGIS as a GIS software lacks some cartographic capabilities for drafting of work. We are often left with converting/ exporting our GIS work into a CAD environment and after some modifications in CAD environment, the work is exported back to ArcGIS environment. GIS lacks some conventional cartographic signs and symbols and does not allow free sketching of such signs/ symbols, a times we make do with Adobe Illustrator and other softwares to aid us.        The question therefore is,  how can we fuse in CAD capabilities into GIS environment?  I found out a simple method of doing this. You can convert your shape file to CAD file. Without closing the ArcGIs, open the CAD file and do the necessary modifications on the CAD  work. Use layer plotting for all text files, signs and symbols so that they can come out as layers in ArcGIS. After all the modifications both the layout and adjustments in the digitized features (Point, Line and Polygon) .Save your CAD work and open your ArcGIS file which u minimized and you will find all the modifications on your ArcGIS.                      Cheers.

STEPS FOR CONVERTING YOUR ArcGIS SHAPE FILE TO CAD.                                    1.Goto ArcToolbox.                     
2.Select Conversion Tools.                                     3.Select to CAD. Select ,Export to CAD.           Under Input Features, (select the shape files you want to convert). Under Output Type( select the DWG- the AutoCAD version u want to save it),  Under output file(Select the folder you want to save it).                                           4. Select Ok and wait for the files to convert/export to CAD. When its successful, it pops out successful message on the ArcGIS environment

Saturday 27 July 2019

The Trapezoidal Rule

The Trapezoidal Rule

by M. Bourne

Interactive exploration

See an applet where you can explore Simpson's Rule and other numerical techniques:
Riemann Sums Applet
Problem: Find
\displaystyle{\int_{{0}}^{{1}}}\sqrt{{{x}^{2}+{1}}}\ {\left.{d}{x}\right.}
We put \displaystyle{u}={x}^{2}+{1} then \displaystyle{d}{u}={2}{x}\ {\left.{d}{x}\right.}.
But the question does not contain an `x\ dx` term so we cannot solve it using any of the integration methods we have met so far.
We need to use numerical approaches. (This is usually how software like Mathcad or graphics calculators perform definite integrals).
We can use one of two methods:
  • Trapezoidal rule
  • Simpson's Rule (in the next section: Simpson's Rule)
Continues below 

The Trapezoidal Rule

We saw the basic idea in our first attempt at solving the area under the arches problem earlier.
Instead of using rectangles as we did in the arches problem, we'll use trapezoids (trapeziums) and we'll find that it gives a better approximation to the area.
y0
\displaystyle\Delta{x}
y1
\displaystyle\Delta{x}
y2
\displaystyle\Delta{x}
y3
\displaystyle\Delta{x}
y4
\displaystyle\Delta{x}
y5
\displaystyle\Delta{x}
y6
The approximate area under the curve is found by adding the area of all the trapezoids.
(Recall that we write "Δx" to mean "a small change in x".)

Area of a trapezoid

\displaystyle{p}
\displaystyle{q}
\displaystyle{h}
\displaystyle\text{Area}=\frac{h}{{2}}{\left({p}+{q}\right)}
Now, the area of a trapezoid (trapezium) is given by:
\displaystyle\text{Area}=\frac{h}{{2}}{\left({p}+{q}\right)}
We need "right" trapezoids (which means the parallel sides are at right angles to the base), and they are rotated 90° so that their new base is actually h, as follows, and h = Δx.
y0
y1
\displaystyle\Delta{x}
A "typical" trapezoid
So the total area is given by:
\displaystyle\text{Area}\approx\frac{1}{{2}}{\left({y}_{{0}}+{y}_{{1}}\right)}\Delta{x}+ \displaystyle\frac{1}{{2}}{\left({y}_{{1}}+{y}_{{2}}\right)}\Delta{x}+ \displaystyle\frac{1}{{2}}{\left({y}_{{2}}+{y}_{{3}}\right)}\Delta{x}+\ldots
We can simplify this to give us the Trapezoidal Rule, for \displaystyle{n} trapezoids:
\displaystyle\text{Area}\approx \displaystyle\Delta{x}{\left(\frac{{{y}_{{0}}}}{{2}}+{y}_{{1}}+{y}_{{2}}+{y}_{{3}}+\right.} \displaystyle{\left.\ldots+\frac{{{y}_{{n}}}}{{2}}\right)}
To find \displaystyle\Delta{x} for the area from \displaystyle{x}={a} to \displaystyle{x}={b}, we use:
\displaystyle\Delta{x}=\frac{{{b}-{a}}}{{n}}
and we also need
\displaystyle{y}_{{0}}= f{{\left({a}\right)}}
\displaystyle{y}_{{1}}= f{{\left({a}+\Delta{x}\right)}}
\displaystyle{y}_{{2}}= f{{\left({a}+{2}\Delta{x}\right)}}
\displaystyle\ldots
\displaystyle{y}_{{n}}= f{{\left({b}\right)}}

Note

  • We get a better approximation if we take more trapezoids [up to a limit!].
  • The more trapezoids we take, \displaystyle\Delta{x} will tend to \displaystyle{0}, that is, \displaystyle\Delta{x}\rightarrow{0}.
  • We can write (if the curve is above the x-axis only between \displaystyle{x}={a} and \displaystyle{x}={b}):
\displaystyle\text{Area}={\int_{{a}}^{{b}}} f{{\left({x}\right)}}{\left.{d}{x}\right.}
\displaystyle\approx \displaystyle\Delta{x}{\left(\frac{{{y}_{{0}}}}{{2}}+{y}_{{1}}+{\left.\ldots+\frac{{{y}_{{n}}}}{{2}}\right)}\right.}

Don't miss...

There is an interactive applet where you can explore the Trapezoid Rule, here:

Exercise

Using \displaystyle{n}={5}, approximate the integral:
\displaystyle{\int_{{0}}^{{1}}}\sqrt{{{x}^{2}+{1}}}\ {\left.{d}{x}\right.}
Answer

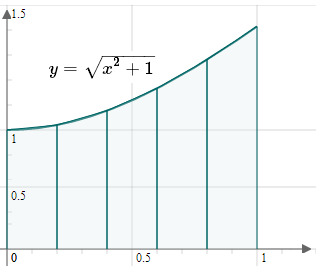
This is the situation:
square root trapezoidal
I have joined each of the points at the top of the vertical segments with a straight line.
Here, \displaystyle{a}={0} and \displaystyle{b}={1}, and the width of each trapezoid is given by:
\displaystyle\Delta{x}={\frac{{{b}-{a}}}{{{n}}}}={\frac{{{1}-{0}}}{{{5}}}}={0.2}
\displaystyle{y}_{{0}}= f{{\left({a}\right)}}= \displaystyle f{{\left({0}\right)}}=\sqrt{{{0}^{2}+{1}}}={1}
\displaystyle{y}_{{1}}= f{{\left({a}+\Delta{x}\right)}}= \displaystyle f{{\left({0.2}\right)}}=\sqrt{{{0.2}^{2}+{1}}}={1.0198039}
\displaystyle{y}_{{2}}= f{{\left({a}+{2}\Delta{x}\right)}}= \displaystyle f{{\left({0.4}\right)}}=\sqrt{{{0.4}^{2}+{1}}}={1.0770330}
\displaystyle{y}_{{3}}= f{{\left({a}+{3}\Delta{x}\right)}}= \displaystyle f{{\left({0.6}\right)}}=\sqrt{{{0.6}^{2}+{1}}}={1.1661904}
\displaystyle{y}_{{4}}= f{{\left({a}+{4}\Delta{x}\right)}}= \displaystyle f{{\left({0.8}\right)}}=\sqrt{{{0.8}^{2}+{1}}}={1.2806248}
\displaystyle{y}_{{5}}= f{{\left({a}+{5}\Delta{x}\right)}}= \displaystyle f{{\left({1.0}\right)}}=\sqrt{{{1}^{2}+{1}}}={1.4142136}
So we have:
\displaystyle\text{Integral}\approx
\displaystyle{0.2}{\left(\frac{1}{{2}}\times{1}+{1.0198039}\right.} \displaystyle+{1.0770330}+{1.1661904} \displaystyle{\left.+{1.2806248}+\frac{1}{{2}}\times{1.4142136}\right)}
\displaystyle={1.150}
So \displaystyle{\int_{{0}}^{{1}}}\sqrt{{{x}^{2}+{1}}}\ {\left.{d}{x}\right.}\approx{1.150}
We can see in the graph above the trapezoids are very close to the original curve, so our approximation should be close to the real value. In fact, to 3 decimal places, the integral value is 1.148.